🚀 Tableau Pulse Hands-On Workshop
Instructor : Vorapol Ping (Tableau #DataDev Ambassador) | vorapol@bac.co.th
Workshop URL: bit.ly/tab-pulse-workshop
Workshop content valid until 2026-06-20.
Welcome. In this workshop you'll go from "What is Tableau Pulse?" to building, validating, and consuming AI-generated metrics in one session.
Tableau Pulse changes the delivery model for analytics: instead of users opening dashboards to look for answers, defined metrics push their changes and likely drivers to the people who follow them - in plain language, by email or Slack, on any device. Building a metric is the easy part. Whether a Pulse rollout succeeds is decided by metric selection, trust in the numbers, and fit with how the business already makes decisions - so this workshop covers the build and those success factors.
📦 Workshop Files:
File Used in Download SuperStoreSimple.csvPart 2 - Your First Pulse Metric Download SuperStore.csvPart 6 - Dynamic Goals Download SuperStoreTarget.csvPart 6 - Dynamic Goals Download Workshop.csvPart 8 - Your Turn! Download
Before you start: register a Tableau ID.
You'll need a free Tableau account to sign in to Tableau Cloud during the workshop.
If you don't already have one, create it now at id.tableau.com, so you're ready to go when we begin.
🎯 What You'll Learn
| Part | Topic | You'll be able to… |
|---|---|---|
| 1 | Getting Started | Navigate Tableau Cloud and enable Tableau AI |
| 2 | Your First Pulse Metric | Publish a data source and define a metric |
| 3 | Insights, Follows & Goals | Read insights, subscribe, and set goals |
| 4 | AI-Powered Exploration | Ask questions and chat with your data |
| 5 | Advanced Metrics & Validation | Build compound metrics and prove insights are correct |
| 6 | Dynamic Goals | Drive goals from a target dataset |
| 7 | Pulse On the Go | Consume metrics on Tableau Mobile |
| 8 | Making Tableau Pulse Successful | Business mindset first or Pulse fails |
Sections marked 🎓 Instructor Led are demonstrations - watch and ask questions.
Sections marked 🙌 Follow Along are hands-on - you'll do each step yourself.
🧭 Part 1 - Getting Started
Before we build anything, let's get oriented: what Pulse is, where it lives, and how to switch on the AI that powers it.
1. Tableau Pulse Introduction - 🎓 Instructor Led
Your instructor will give you an overview of Tableau Pulse: the problem it solves, how it differs from traditional dashboards, and the core building blocks - metric definitions, metrics, and insights.

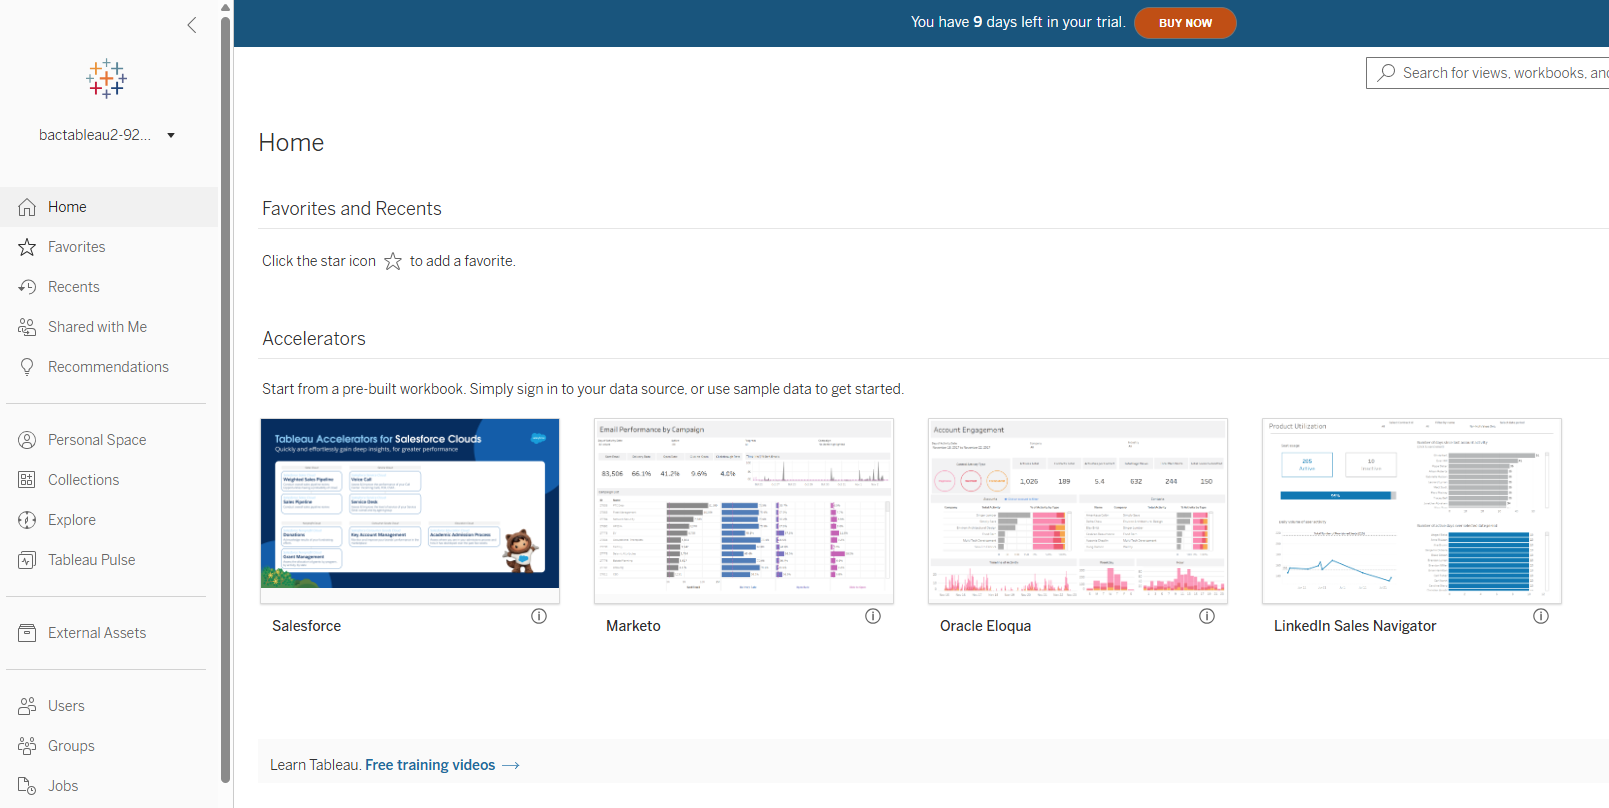
2. Tableau Cloud User Interface - 🎓 Instructor Led
Pulse lives in Tableau Cloud, so we'll start with a quick walkthrough of the Cloud interface - where your content lives, how projects are organized, and where to find Pulse in the navigation.
3. Accessing Tableau Pulse and Tableau AI - 🎓 Instructor Led
Pulse's natural-language summaries are powered by Tableau AI, which a site admin must enable first. Your instructor will:
- Show you how to enable Tableau AI on the site
- Guide you through the Tableau Pulse interface itself
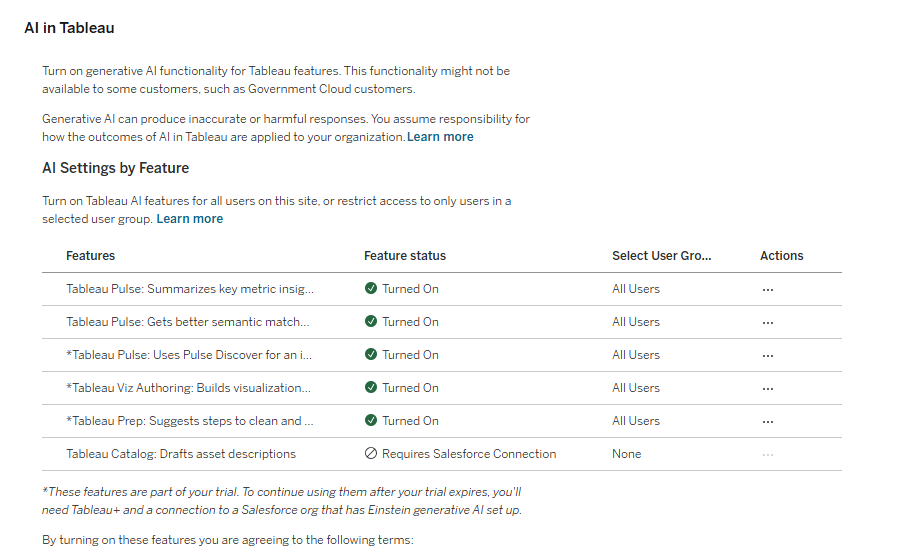
✅ Checkpoint: You can open Tableau Pulse from Tableau Cloud and Tableau AI is enabled.
🧱 Part 2 - Your First Pulse Metric
Pulse metrics are built on published data sources, so the quality of the data source sets the ceiling for everything downstream. In this part you'll publish one, then define a metric on top of it.
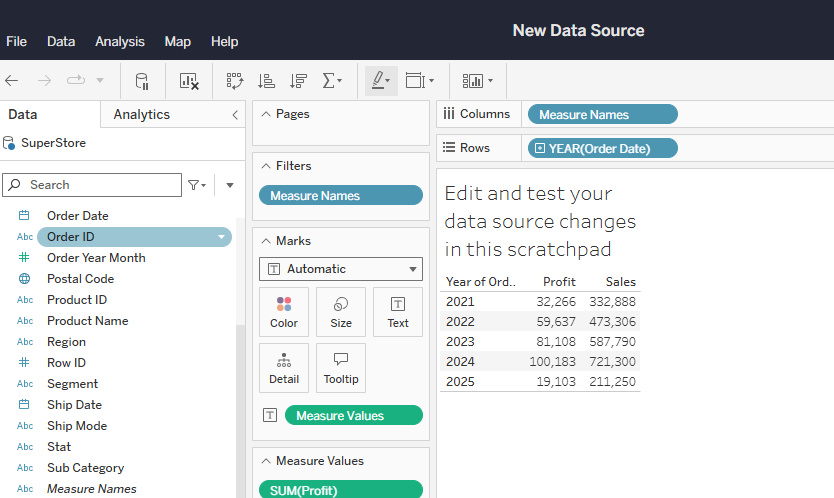
4. Prepare a Published Data Source (PDS) - 🎓 Instructor Led, then 🙌 Follow Along
Pulse metrics are built on published data sources. Your instructor will demonstrate how to create one in Tableau Cloud using SuperStoreSimple.csv - then it's your turn.
This workshop runs on a shared tenant, so identical names will collide. Publish your data source under your assigned number - Simple-01, Simple-02, Simple-03, … as instructed - to avoid overwriting another participant's work.
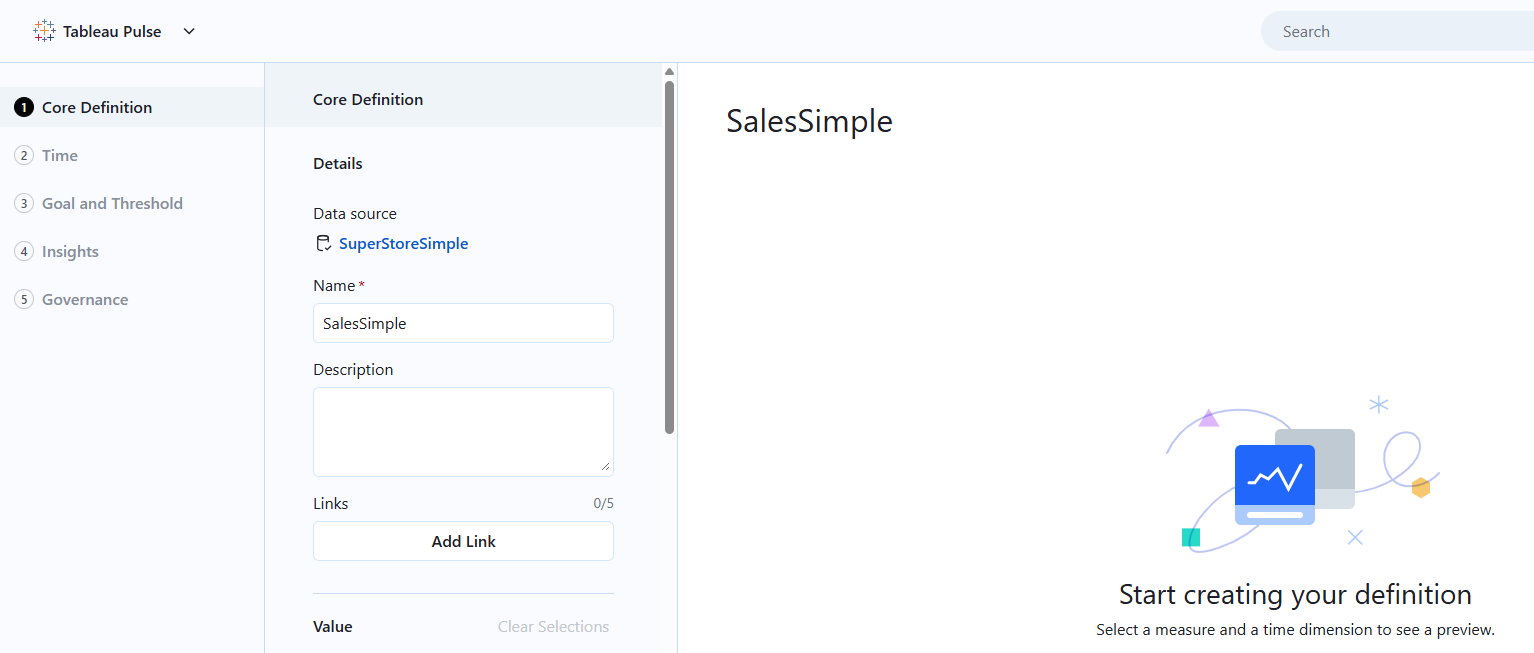
5. Create a Simple Pulse Metric: "Sales Simple" - 🙌 Follow Along
Now you'll define your first metric, "Sales Simple", on top of your published data source.
Your instructor will walk through every configurable option as you build - measure, aggregation, time dimension, and filters - so you understand what each setting controls and when you would change it.
Add Category, Region, and Segmentas adjustable filters. Each follower can then scope the metric to their own part of the business - one definition serving many audiences, with no additional build work.
6. Anatomy of a Pulse Metric Definition - 🎓 Instructor Led
Here's the key mental model: a metric definition is the single source of truth (measure + time + filters + insight settings), and each filtered variation users follow is a metric. One definition, many metrics - that's how Pulse scales without metric sprawl.
✅ Checkpoint: Your "Sales Simple" metric is live and showing data.
💡 Part 3 - Insights, Follows & Goals
A metric only creates value when someone reads it and acts on it. This part covers the consumption side: understanding the insights Pulse generates, following metrics so they reach you on a schedule, and giving them a target to measure against.
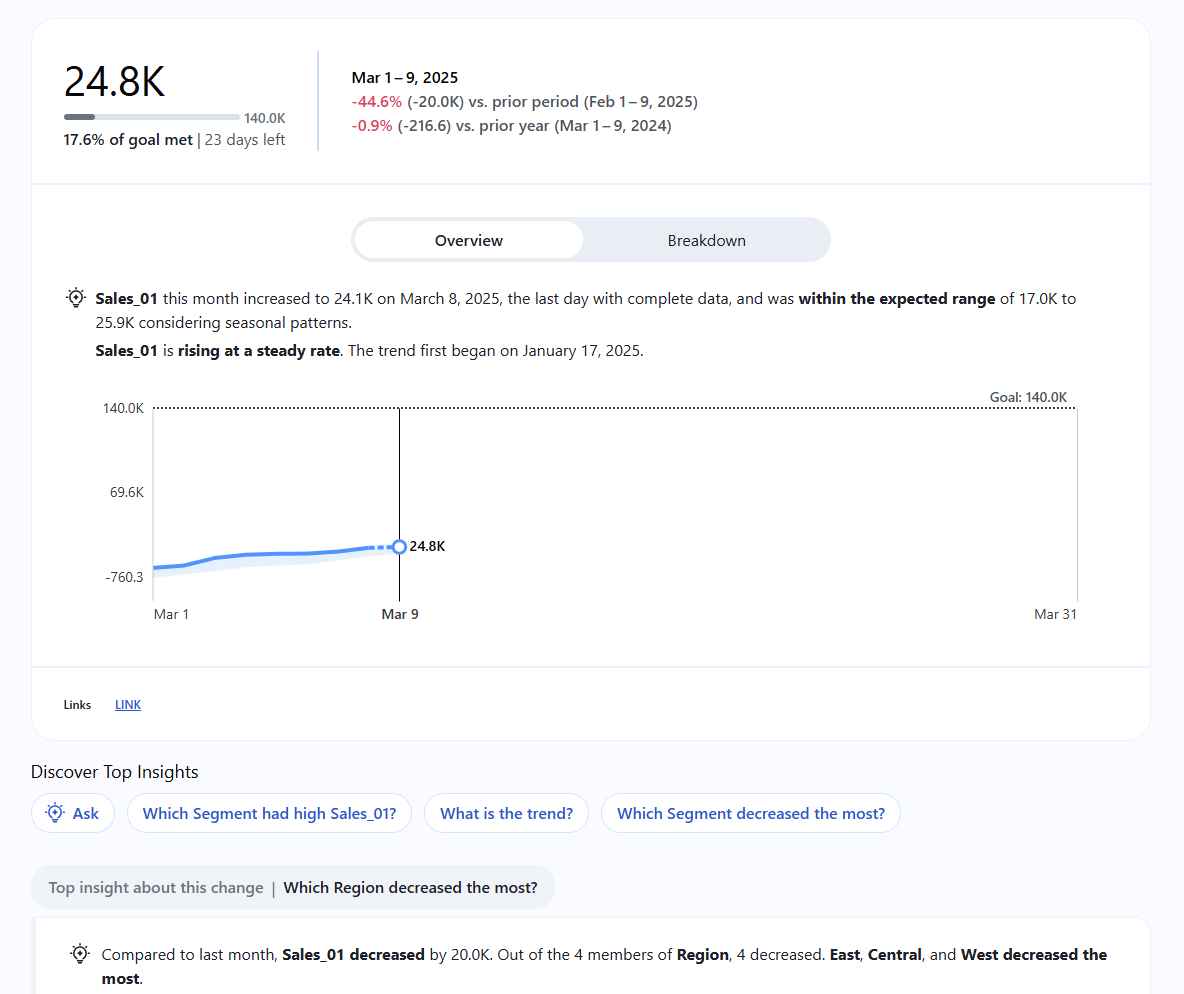
7. Reading Pulse Insights - 🎓 Instructor Led
Alongside each trend line, Pulse generates a plain-language explanation of what moved and what drove it. Your instructor will guide you through interpreting these automatically generated insights.
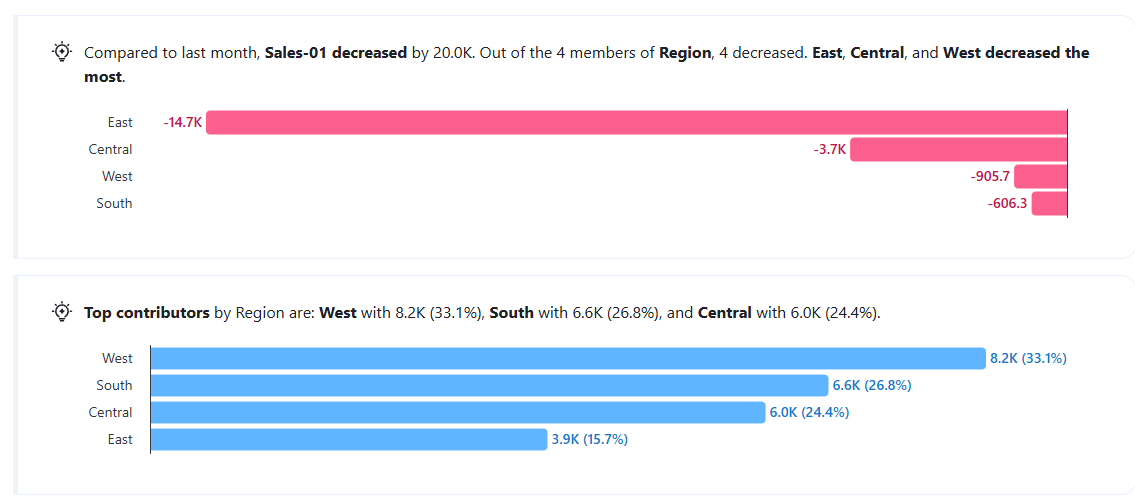
Pulse draws from several insight types, including:
- 🔵 Top Contributor - which dimension member drove the metric up
- 🔵 Top Detractor - which dimension member dragged it down
- 🟠 Grouped Contributor / Detractor - patterns across groups of members
- ⚪ Polarity - whether a change is good or bad for your business
- Significant 🔴 Decrease / 🟢 Increase (by time) - unusual movement versus the norm
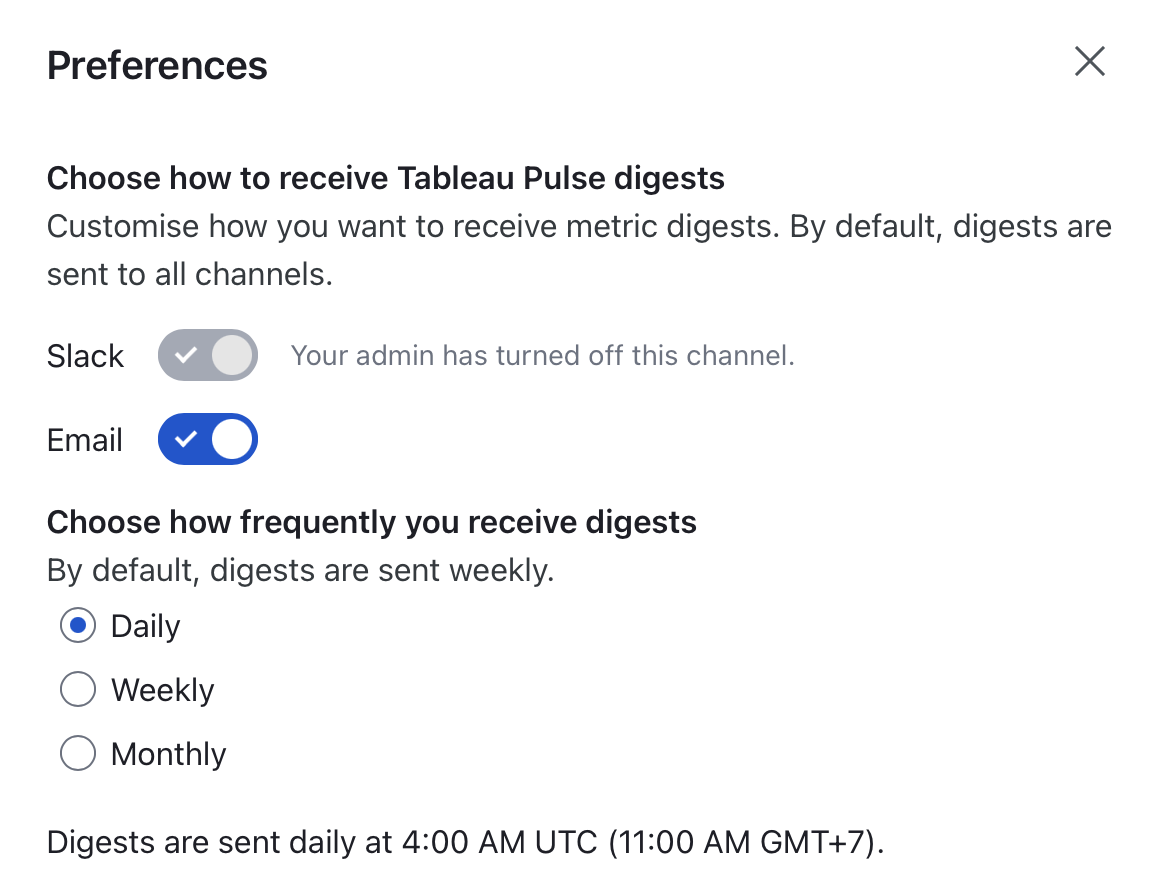
8. Follow a Pulse Metric - 🙌 Follow Along
Following is how insights reach you automatically. Your instructor will show you how to follow a metric and configure your digest - the email/Slack summary Pulse sends on your schedule.
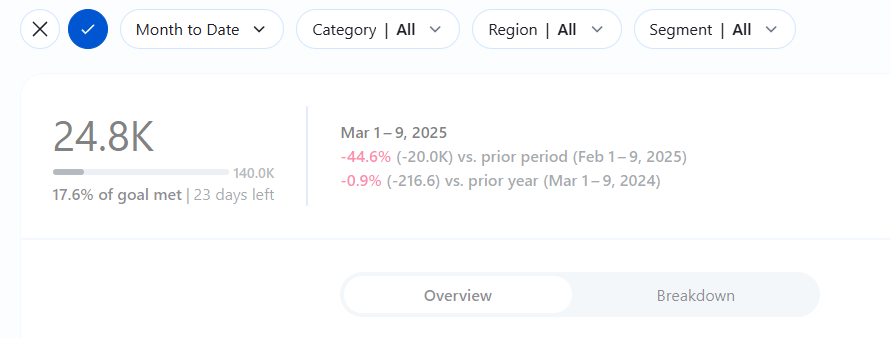
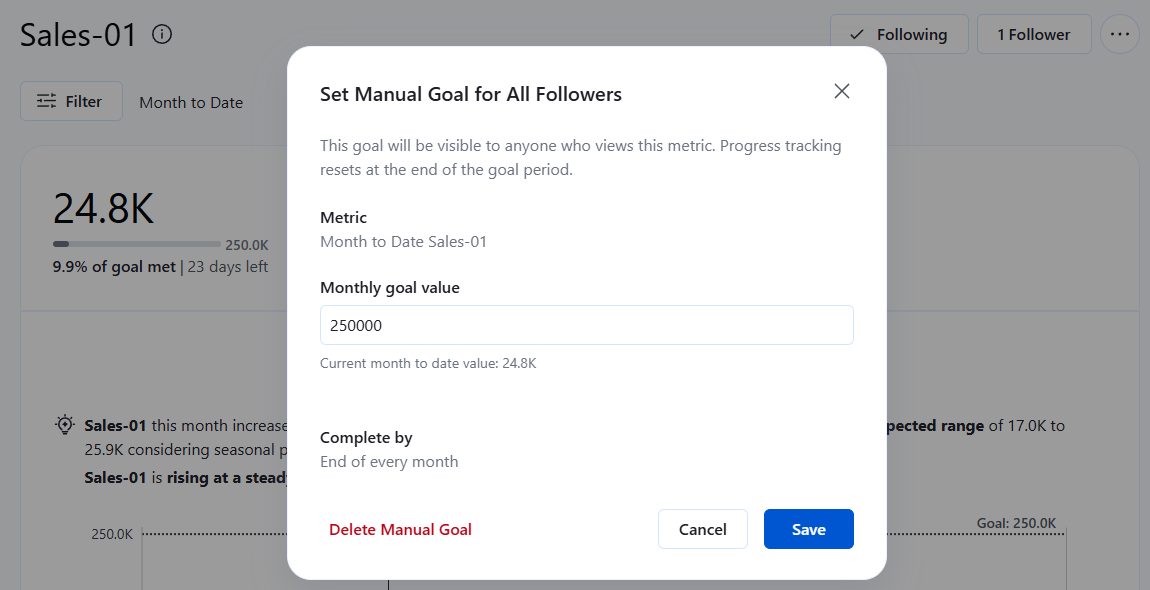
9. Set Up a Tableau Pulse Goal - 🙌 Follow Along
Without a target, a metric can't tell anyone whether performance is acceptable. Goals give Pulse a reference point, so insights report position against plan ("you're on track") rather than movement alone ("sales went up").
📚 Deep dive: Tableau Help - Pulse Goals
✅ Checkpoint: You're following "Sales Simple" and it has a goal.
🤖 Part 4 - AI-Powered Exploration
You've seen the insights Pulse pushes to you. Now let's pull - asking Pulse questions in natural language.
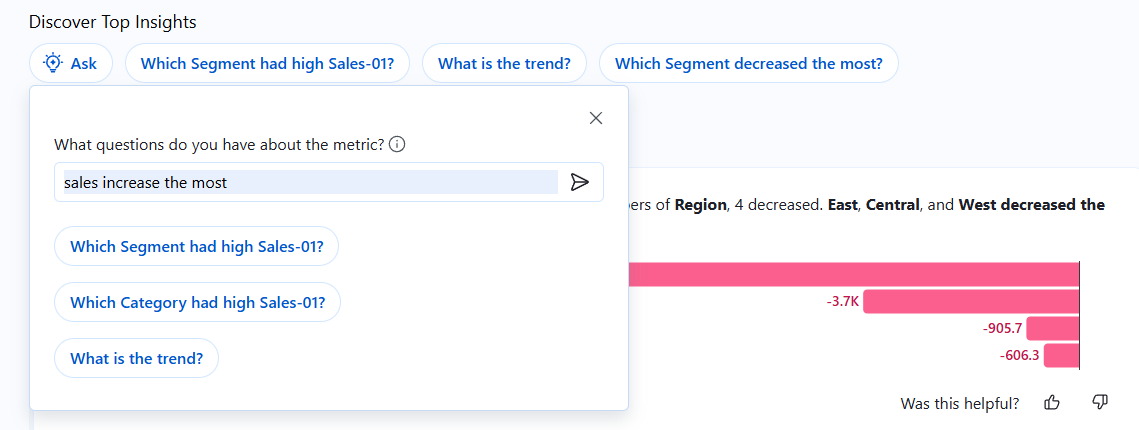
10. AI-Based Insight Searching - 🙌 Follow Along
Your instructor will show you how to ask Tableau Pulse for insights - using the guided Q&A to dig into why a metric moved.
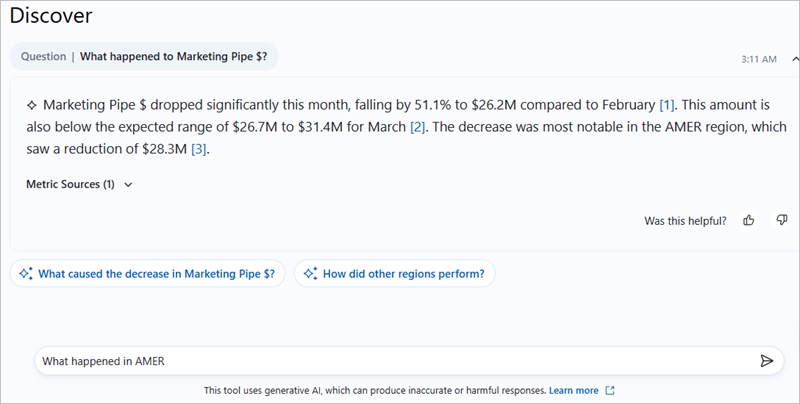
11. AI-Based Chat with Data: Pulse Discover - 🎓 Instructor Led
Tableau Pulse Discover extends the guided Q&A into open-ended conversation with your data. Your instructor will demonstrate where it works well - and where its boundaries are, because knowing the limits is what lets you set realistic expectations with stakeholders.
🧪 Part 5 - Advanced Metrics & Validation
Real business questions rarely map to a single column. This part covers ratio-style compound metrics, deeper insight analysis, and the step that decides whether any of it gets adopted: independently verifying what the AI reports.
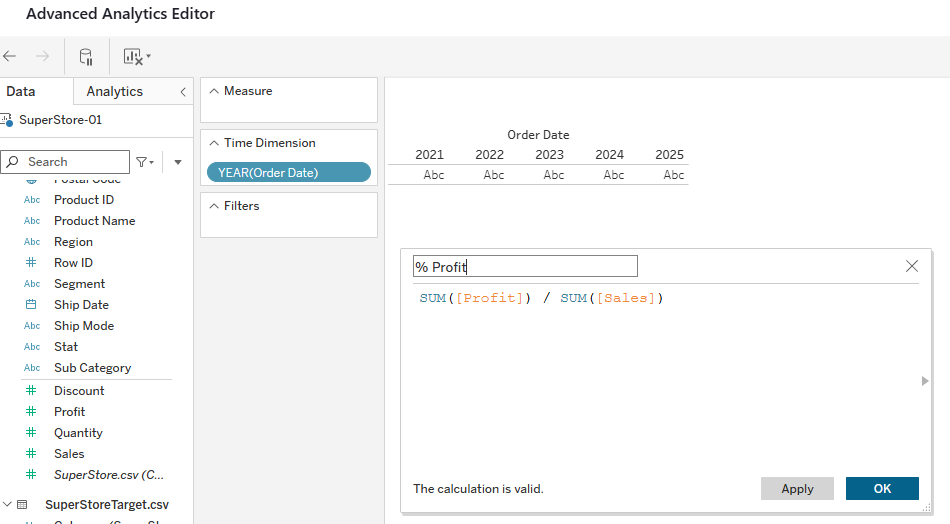
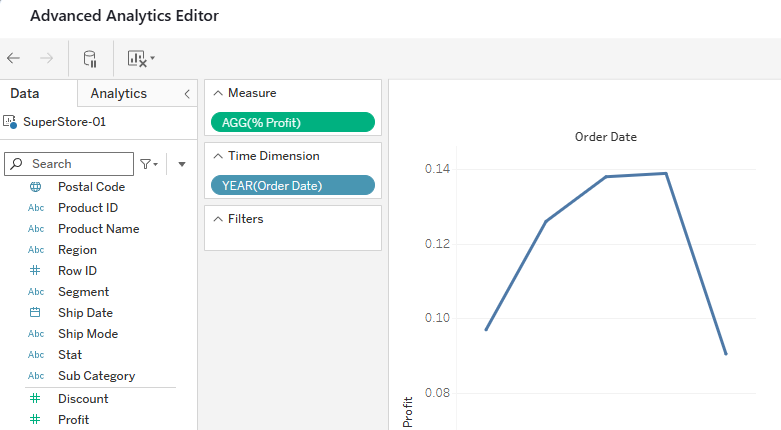
12. Compound / Composite Metrics - 🙌 Follow Along
Metrics like profit ratio or average order value are calculations, not columns. Your instructor will guide you through creating a compound metric inside the Pulse metric definition.
13. Insight Analysis - 🎓 Instructor Led
With compound metrics in play, insights get richer - and trickier to interpret. Your instructor will walk through reading these insights and explain why compound metrics matter for serious data analysis.
14. How to Prove Tableau Pulse Is Correct? - 🎓 Instructor Led (Optional)
Trust is the #1 adoption blocker for AI-generated insights.The fastest way to build trust? Verify the numbers yourself, in front of your stakeholders.
Your instructor will show you how to test the validity of the insights Pulse generates for each use case - recreating the math independently so you can stand behind every headline.
✅ Checkpoint: You have a compound metric, and you know how to verify its insights.
🎯 Part 6 - Dynamic Goals
Static goals are fine - until the business hands you a target file with different targets per month, category, and segment. Dynamic goals connect your metric to real planning data.
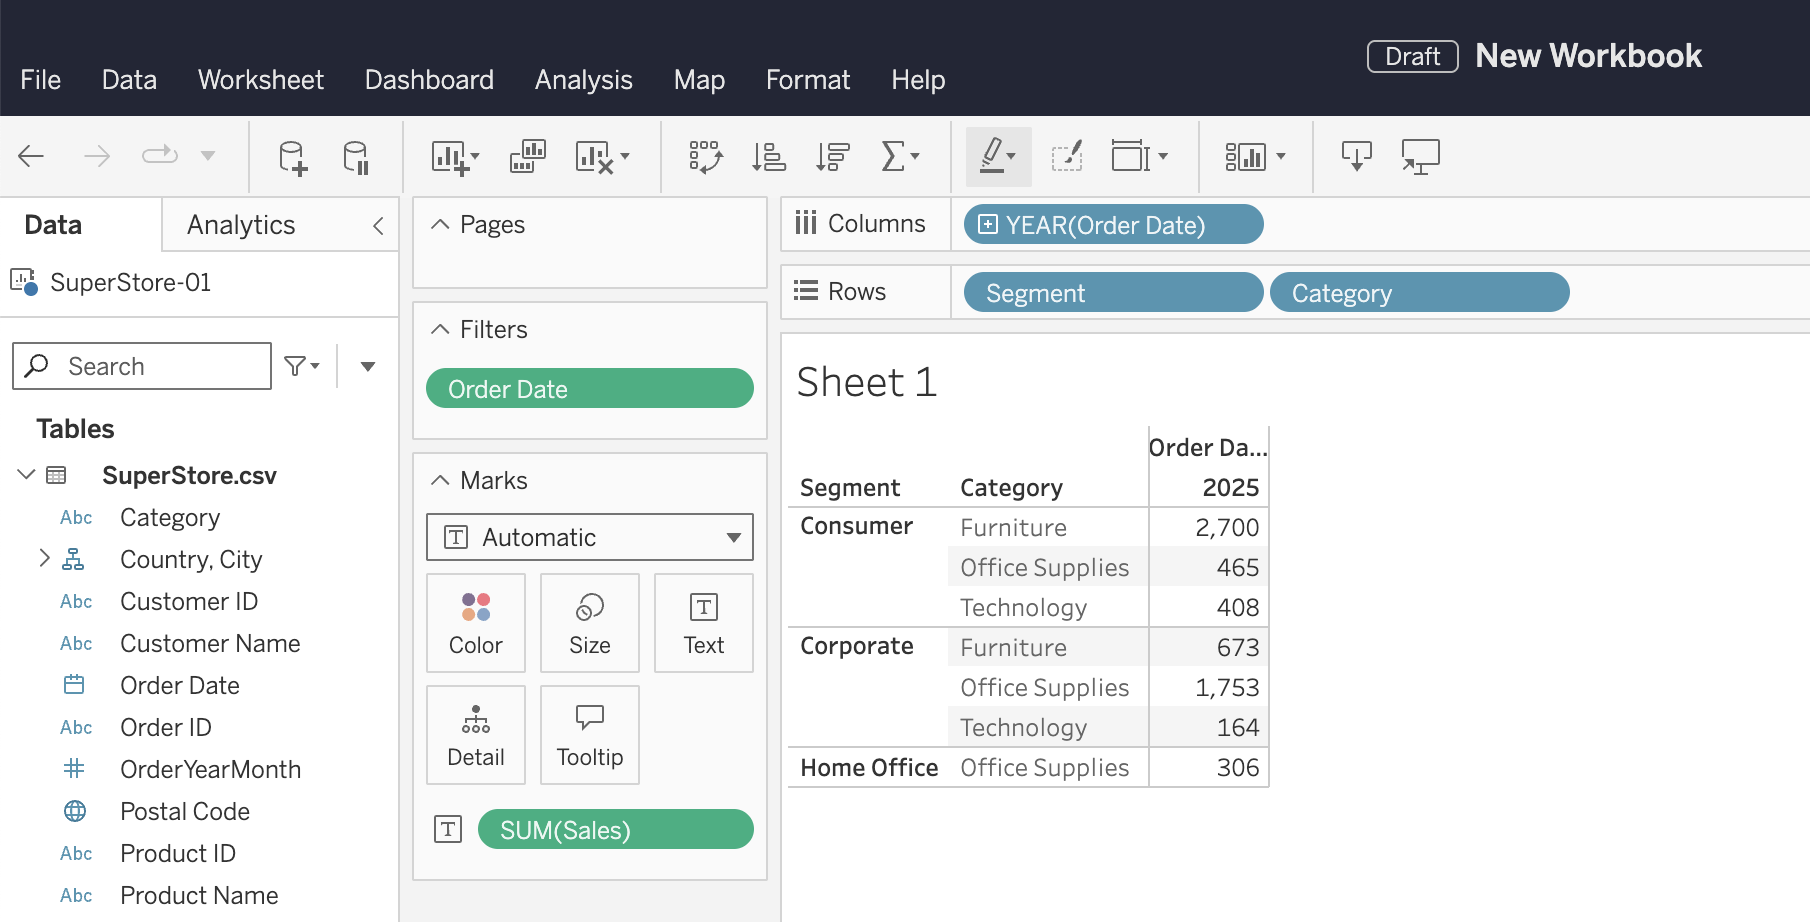
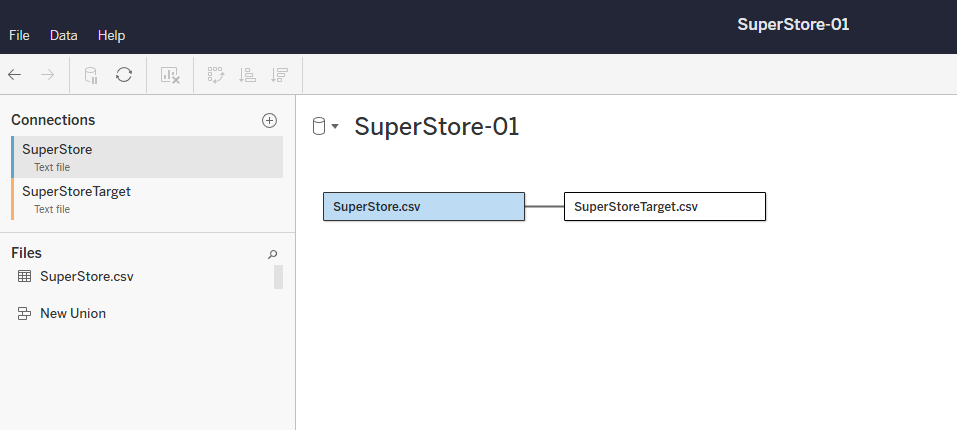
15. Dynamic Goal, Step 1: Extend the Data Model - 🙌 Follow Along
Download the two new datasets:
| Dataset | Link |
|---|---|
| SuperStore | SuperStore.csv |
| SuperStoreTarget | SuperStoreTarget.csv |
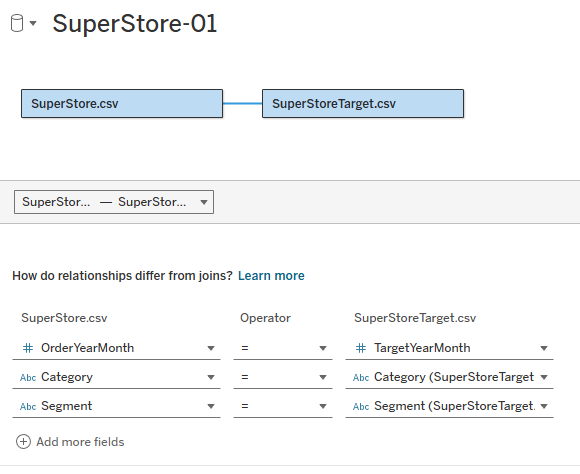
Your instructor will guide you through adding the target dataset into the data model:
Create relationships between the two tables:
- OrderYearMonth ↔ TargetYearMonth
- Then Category ↔ Category
- Then Segment ↔ Segment
16. Dynamic Goal, Step 2: Point the Metric at the Target - 🙌 Follow Along
With targets in the model, your instructor will show you how to set a measure as the goal in the metric definition - so the goal moves with the plan, not with manual edits.
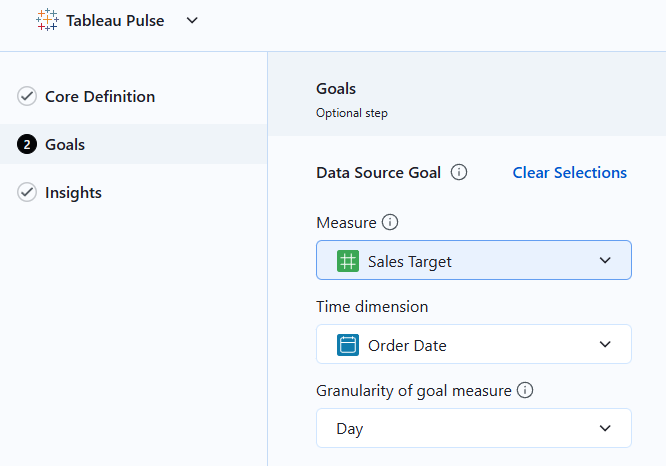
✅ Checkpoint: Your metric's goal now comes from SuperStoreTarget - per month, per category, per segment.
📱 Part 7 - Pulse On the Go
Insights are most valuable at the moment of decision - which is rarely at a desk.
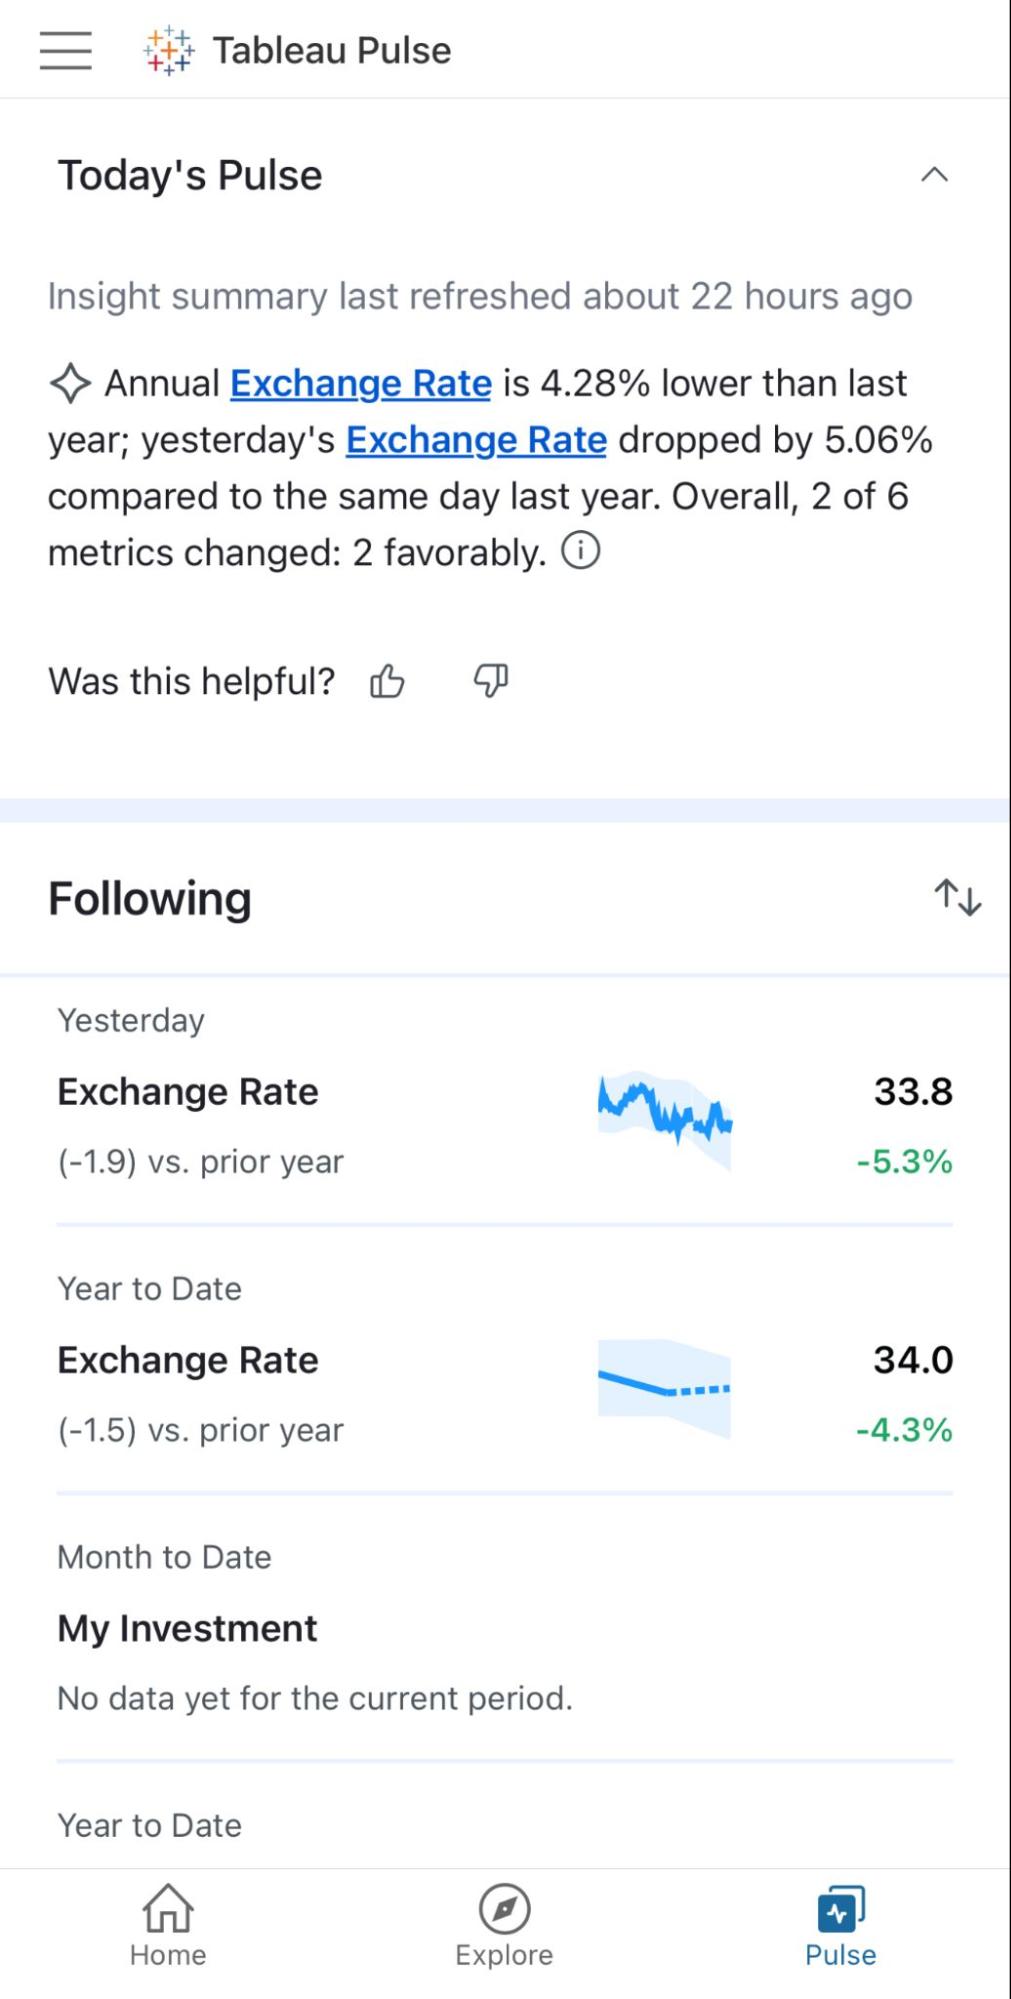
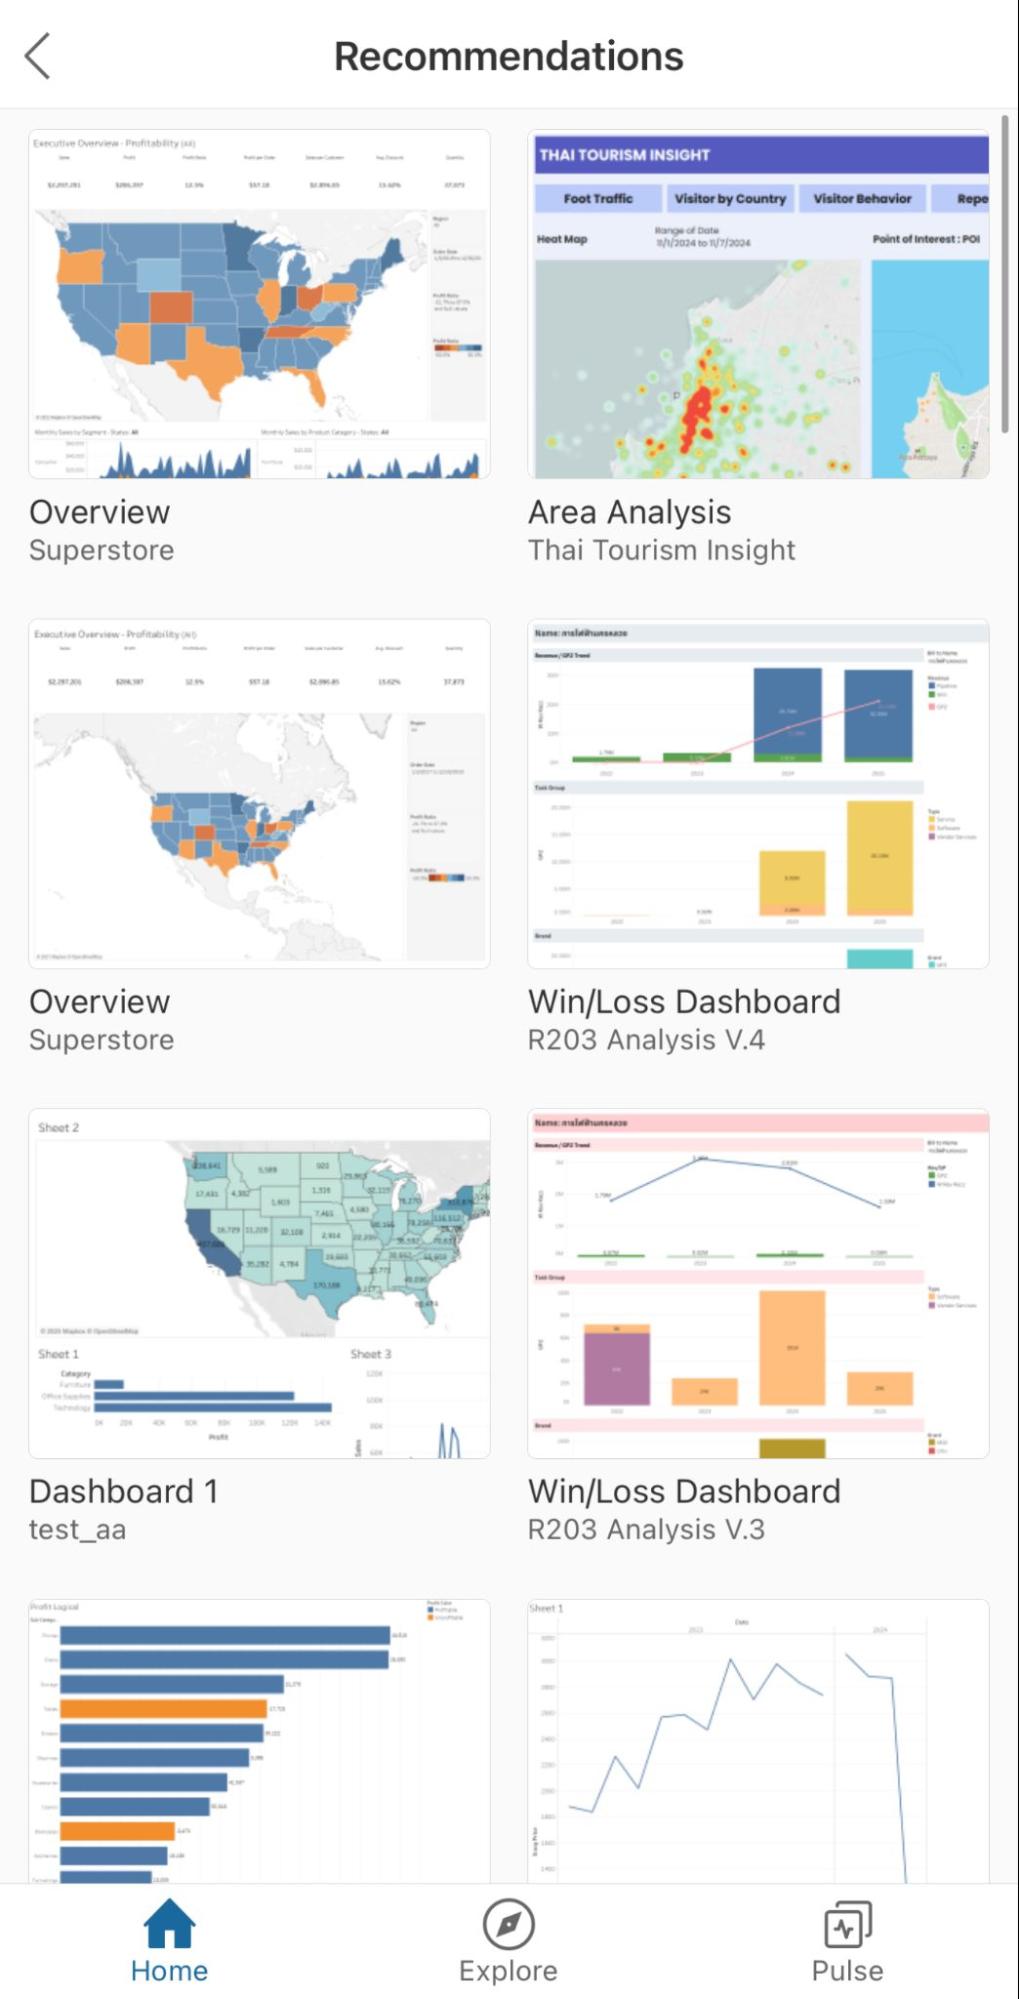
17. Tableau Mobile - 🙌 Follow Along
Your instructor will guide you through consuming your Pulse metrics on the Tableau Mobile app (iOS and Android) - the same metrics, insights, and digests, in your pocket.
🏁 Part 8 - Make Tableau Pulse Success
Without a business-first mindset, Tableau Pulse is just another tool.
KPI Card Design - 🎓 Instructor Led
A Pulse metric is only as good as the KPI behind it. Before you build anything in Tableau, write the KPI down as a KPI card - a one-pager that captures everything a metric's audience needs to agree on before the metric exists. It's a design exercise, not documentation after the fact: filling in the card surfaces the hard questions (what exactly are we measuring? who owns it? what do we do when it moves?) while they're still cheap to answer.
A good KPI card has two sides. The first side defines what the metric is:
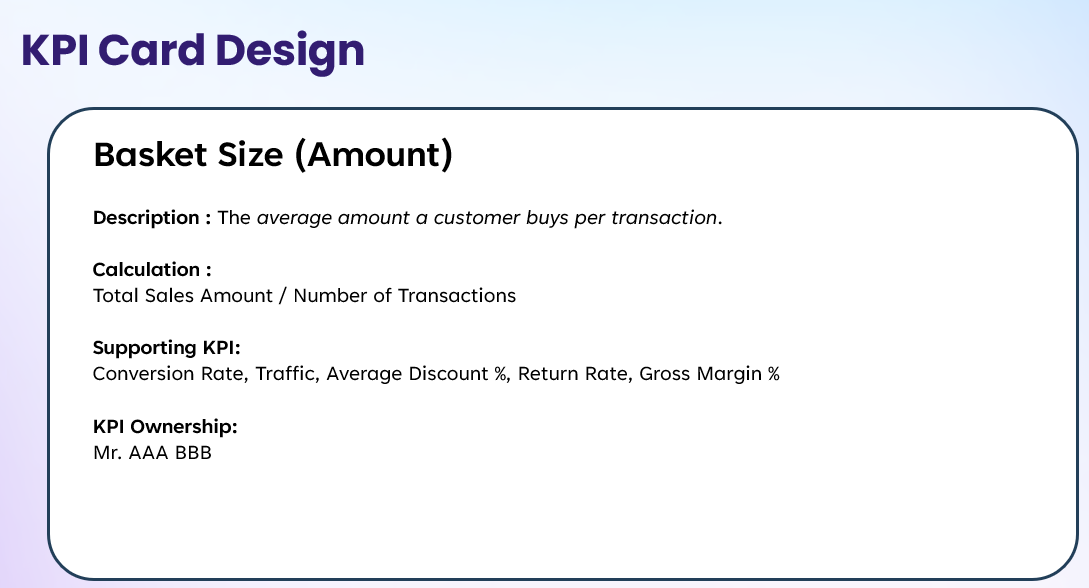
- Description - the metric in one plain-language sentence. If it takes a paragraph, the metric is not understood well enough to automate.
- Calculation - the exact formula, so two people computing it get the same number. This is what becomes your value definition (or compound metric) in Pulse.
- Supporting KPIs - the related measures you'd check to explain a movement. In Pulse, these are your candidates for related metrics and adjustable filters.
- Ownership - one named person accountable for the number. Shared ownership is no ownership.
The second side defines what the metric means - and this is the side most teams skip:
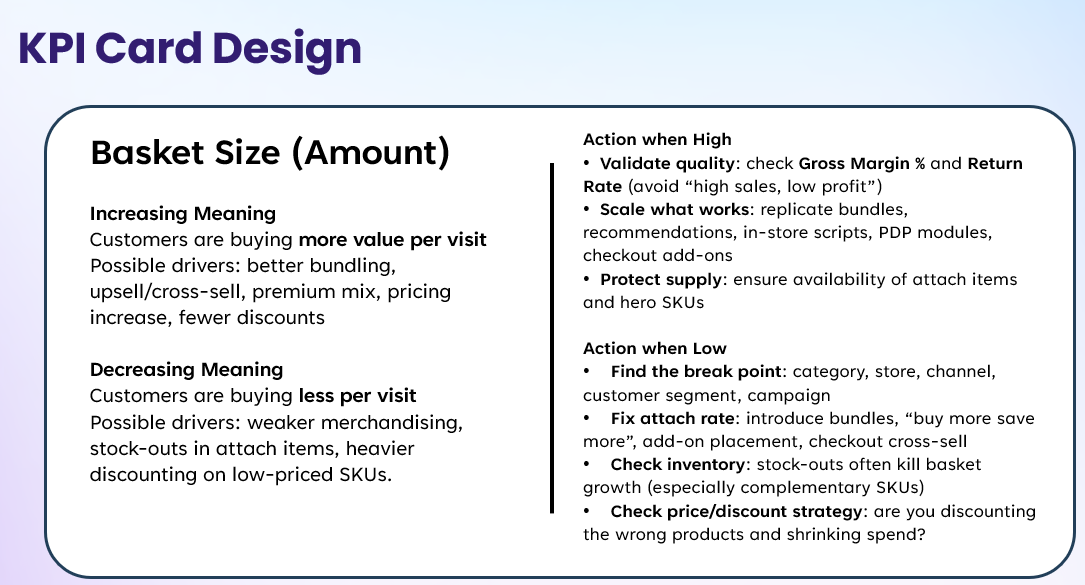
- Increasing / Decreasing meaning - what a move in each direction actually says about the business, and the likely drivers behind it. Up is not always good and down is not always bad.
- Action when High / Action when Low - the concrete first steps someone should take when the metric crosses into either zone. This turns a number into a decision.
Why does this matter for Pulse? Because Pulse automates the detection - "Basket Size is down 12%" - but detection without interpretation just creates anxiety. The card is the playbook that tells every follower of the metric what that insight means and where to look first.
The "Action when Low" box is the acid test. If nobody can write down what to do when the metric drops, it isn't ready to be a Pulse metric - an insight nobody can act on is just noise in someone's digest.
Tableau Pulse Pitching - 🎓 Instructor Led
The recurring lesson from real deployments: technical excellence alone doesn't make Pulse succeed. Adoption comes from the business side - picking metrics people actually care about, framing insights in business language, and fitting Pulse into existing decision rhythms. Your instructor will share how to position Pulse with business stakeholders so it lands.
🔥 Your Turn!
Every step so far was guided. Now you'll run the full lifecycle on your own - the same sequence you would follow with a real business dataset.
Download the dataset: Workshop.csv
Then work through the complete Pulse workflow:
- Define a business goal - what decision should this data support?
- Select features - which columns matter? Which should be excluded?
- Create a compound metric - go beyond a single column
- Find an insight - what story does Pulse surface in this dataset?
- Consume it on your phone - close the loop on Tableau Mobile
Start with the business goal, not the data. The best Pulse metric is the one that answers a question someone is already asking every Monday morning.
Happy Tableau-Pulsing! 💙
Workshop content valid until 2026-06-20.